
A good case study isn’t a nice story but a sales tool: in a couple of minutes it shows a prospective client what the problem was, what was done about it and how it all ended in numbers. Below is a framework for writing marketing case studies, tips on visuals and metrics, and a ready-made template.
What a case study does
- Proves experience. It shows you’ve already solved a similar task.
- Speeds up the deal. Many questions are answered before the first meeting.
- Explains the price. When the scope of work and the result are visible, the price feels justified.
The framework: from situation to conclusions
Write all your case studies to the same structure. That makes them easier to compare.
Situation
Describe the client: industry, size, city. State the starting figures and constraints: budget, deadlines, seasonality. Add the hypothesis the strategy was built on.
Goal
One or two measurable KPIs, no more. For example, “reduce cost per lead by 20% in six weeks” or “raise brand awareness in the 18–34 group by a set number of points”.
What was done
Three to six steps:
- which channels were used and what each was responsible for: reach or conversions;
- the creative idea, formats and which A/B tests were run;
- changes to landing pages and the CRM, and the measurement method;
- project stages over time.
Result
- KPI comparison before and after: CPL, CAC, ROI, CTR, VTR, brand awareness and consideration;
- business impact: orders, revenue, repeat purchases, if the data is available;
- methodology: attribution window, control group, where the figures come from;
- a short client testimonial of one or two sentences.
Conclusions
Three points: what worked, what you’ll take into future projects and what you’d do differently.
You can see what this might look like in practice in the agency portfolio.
Visuals: what to show on a page or slide
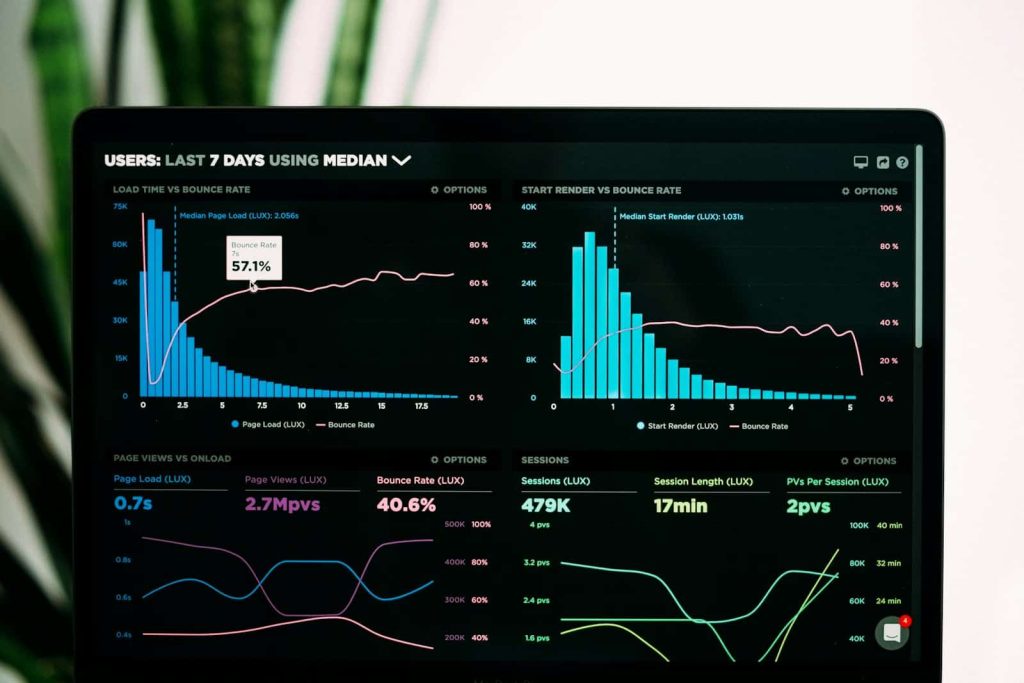
Charts. Limit yourself to one or two. Good options are weekly CPL dynamics with changes marked, an “impressions → clicks → leads → sales” funnel, or a comparison of the first and last week.
Screenshots. Excerpts from the ad account or dashboard with confidential data hidden. Two creative variants or two versions of the landing page’s first screen side by side.
Transparency. Always state the period, currency, attribution window and what was excluded from the calculation, such as cancellations and returns. If some data is covered by a non-disclosure agreement, show changes in percentages and relative figures.
Formats. A detailed article on the website, a one-page PDF for emails and meetings, a carousel for social media.
Mistakes that devalue a case study
- Metrics for the sake of metrics. “Likes went up” says nothing unless it’s linked to a business goal.
- No starting point. Without “before” data, there’s nothing to compare the result with.
- No methodology. If the attribution window and control aren’t stated, the figures are hard to believe.
- A long introduction. By the time the reader gets to the point, they’ll have left.
- Raw screenshots. Busy, tiny images are better replaced with one neat chart.
- A single creative with no comparison. Show the test variants.
A template to fill in
Headline: How [client or industry] cut cost per lead by X% in N weeks
Situation: who the client is, starting figures, constraints
Goal: main KPI and deadline
What was done: 4–6 points covering channels, creative, landing pages, analytics
Result: CPL was X, now Y (−Z%); CTR, VTR and conversion before and after; sales or revenue if available
Methodology: attribution model, window, tools
Client testimonial: “…”
Conclusions: three points
Call to action: “Request a similar plan for your business”
A practice example with hypothetical figures
The figures are made up and only illustrate how to fill in the template.
Situation: a service company in Dushanbe whose leads from search are expensive.
Goal: cut CPL by a quarter in six weeks.
What was done: branded and non-branded queries were separated, short videos with two new hooks were shot, an FAQ was added to the landing page’s first screen, call tracking with number substitution was connected, and retargeting was set up for people who watched the video to the end.
Result: CPL fell from 80 to 58 somoni, CTR rose from 0.8% to 1.2%, website conversion from 3% to 4.8%, and confirmed sales increased by 18%.
Methodology: last click plus control districts without video advertising, 7-day window.
Conclusion: short videos combined with answers to questions on the first screen brought more leads without raising the cost of impressions.
Frequently asked questions
How many case studies should be on display?
A few recent ones covering different industries are enough.
What if an NDA applies?
Show relative changes and the methodology, and remove the client’s name and logo.
Do you need a video version?
A short, lively video helps build trust. You can shoot and edit one with the production team.
If you want to turn your projects into convincing case studies, from gathering the data and drawing the charts to laying out a one-pager, SKY Central Asia specialists can help as part of our content and PR practice.



Leave a comment